You know that feeling when something you learned years ago suddenly clicks into place? I had one of those moments recently while exploring Python’s inspect.currentframe() function. Suddenly, all those “abstract” concepts from my operating systems course—instruction pointers, stack frames, registers—weren’t abstract anymore. They were right there, implemented in Python’s runtime.
That expensive, seemingly impractical systems programming course? It just became useful for understanding Python’s internal machinery. Remind me of a Chinese saying: 塞翁失马焉知非福 — “How do you know if losing a horse isn’t actually a blessing?”
Heres the story about a lost horse and how its actually a blessing.
In ancient times, there was an old man who lived near the border. One day, his prized horse ran away. The neighbors came to offer their sympathy, but the old man just said, “Who’s to say this isn’t a good thing?”
A few months later, the horse returned - with a wild stallion alongside it. The neighbors celebrated his luck, but he calmly replied, “Who’s to say this isn’t a bad thing?”
Not long after, his son tried to ride the new horse, was thrown off, and broke his leg. Again, the neighbors came with condolences. Again, the old man said, “Who’s to say this isn’t a blessing?”
Soon, war broke out. All the able-bodied young men were drafted and many never returned. But the old man’s son, with his injured leg, was spared.
Or to put it more simply in Steve Jobs’ words: “You can’t connect the dots looking forward; you can only connect them looking backwards.”
The Moment It All Connected
Picture this: I’m debugging some Python code when I stumble across inspect.currentframe(). At first glance, it seems like magic—how does Python know where it is in the call stack? But then those half-forgotten memories start flooding back:
Program Counter (PC). Stack frames. Instruction pointers.
Wait a minute. Could Python’s “frames” be related to the same concept I learned about in systems programming? The chunk of memory allocated when a function is called, holding local variables, return addresses, and the current execution state?
Spoiler alert: They absolutely are.
What Your Systems Course Actually Taught You
Let me refresh your memory about what happens at the CPU level when you call a function (because this is where the magic starts):
The Low-Level Reality
When your C program calls a function, the CPU does something beautifully mechanical:
- Saves the current state: The Program Counter (PC)—that’s the “2-letter thing” you half-remembered—points to the next instruction to execute
- Creates a stack frame: A chunk of memory gets allocated on the call stack
- Fills the frame: Local variables, function arguments, return address, sometimes saved registers
- Jumps: PC points to the start of the called function
This stack frame is your function’s temporary workspace—its private memory area containing everything it needs to know about its current state.
A Simple Analogy
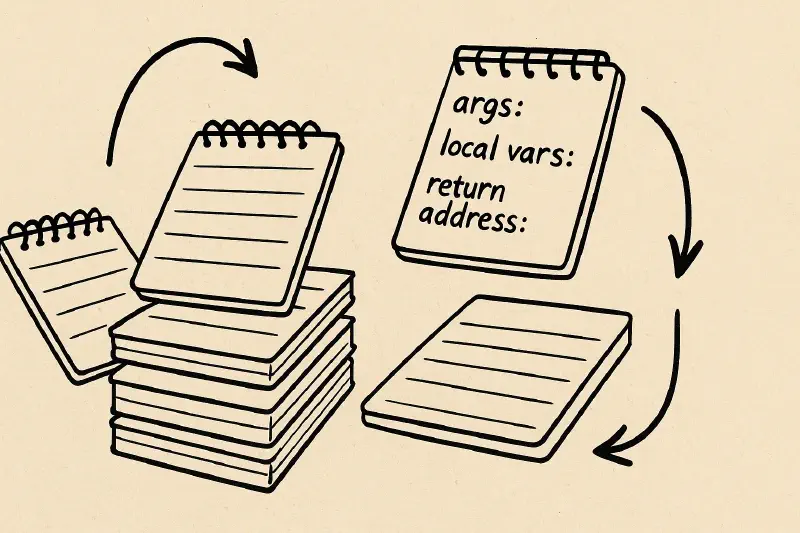
Think of each stack frame as a notepad for your brain. When you start a new task (function call), you grab a fresh notepad and write down:
- What you’re working on (local variables)
- Where you came from (return address)
- What tools you need (arguments)
When you finish the task, you throw away the notepad and return to your previous one.
Python’s Implementation
Here’s where it gets interesting: Python doesn’t compile to native machine code. Instead, it creates its own virtual environment that implements these same concepts.
The Python Virtual Machine
When you run Python code:
.py→.pyc: Your code compiles to Python bytecode (not x86/ARM instructions)- Virtual execution: The CPython interpreter (written in C) executes this bytecode
- Simulated frames: Python maintains its own call stack using
PyFrameObjectstructures
It’s like Python built its own tiny computer inside your computer, complete with its own “CPU” and “stack frames.”
Let’s See It In Action
Here’s the simplest possible example:
def add(x, y):
    z = x + y
    return z

result = add(2, 3)
Seems boring, right? But behind the scenes, Python is doing something fascinating.
Step-by-Step: The PyFrameObject Journey
Let me walk you through exactly what Python’s virtual machine does when you call add(2, 3):
Step 1: The Setup
Python creates a new PyFrameObject—think of it as Python’s version of a stack frame. This object contains:
// Simplified version of what's in CPython's source
typedef struct _frame {
    struct _frame *f_back;      // Previous frame (linked list)
    PyCodeObject *f_code;       // Bytecode being executed
    PyObject *f_locals;         // Local variables: {x: 2, y: 3}
    PyObject *f_globals;        // Global variables
    PyObject **f_valuestack;    // Internal evaluation stack
    int f_lasti;                // Current bytecode instruction
} PyFrameObject;
Step 2: The Execution Dance
Python doesn’t execute your code directly. Instead, it translates z = x + y into bytecode that looks roughly like this:
LOAD_FAST    x        # Push x (2) onto value stack
LOAD_FAST    y        # Push y (3) onto value stack
BINARY_ADD            # Pop two values, add → result: 5
STORE_FAST   z        # Store 5 into local variable z
LOAD_FAST    z        # Push z (5) onto stack
RETURN_VALUE          # Pop and return 5
Each instruction manipulates that tiny f_valuestack—Python’s internal scratchpad for calculations.
Step 3: The Introspection Access
And here’s the key point: inspect.currentframe() simply returns a reference to this PyFrameObject. You’re directly accessing Python’s virtual machine state:
import inspect

def add(x, y):
    frame = inspect.currentframe()
    print("Locals:", frame.f_locals)  # {'x': 2, 'y': 3}
    print("Line number:", frame.f_lineno)  # Current line
    return x + y

add(2, 3)
The Stack Connection
Now the pieces fall into place:
stack() vs currentframe()
Remember when I mentioned these functions seem related? They absolutely are:
inspect.currentframe(): Returns the current frame object (top of the stack)inspect.stack(): Returns the entire call stack as a list of frame info- The relationship:
inspect.currentframe()is essentiallyinspect.stack()[-1].frame
import inspect

def foo():
    current = inspect.currentframe()
    stack = inspect.stack()

    print(current is stack[-1].frame)  # True!

foo()
Visualizing the Call Stack
When functions call other functions, Python builds a linked list of frames:
def main():
    foo()

def foo():
    bar()

def bar():
    frames = inspect.stack()
    for frame_info in frames:
        print(f"Function: {frame_info.function}")

# Output:
# Function: bar
# Function: foo
# Function: main
# Function: <module>
Each frame’s f_back pointer creates a breadcrumb trail back to the beginning.
The Exception Trail Mystery
And then there’s inspect.trace()—the breadcrumb trail of doom.
When Things Go Wrong
When an exception occurs, Python captures the current call stack and preserves it as a traceback object. This provides the “how did I get here?” information:
def level1():
    level2()

def level2():
    level3()

def level3():
    1 / 0  # Kaboom! 💥

try:
    level1()
except Exception:
    import inspect
    for frame_info in inspect.trace():
        print(f"Function {frame_info.function} at line {frame_info.lineno}")

# Output:
# Function level3 at line 8
# Function level2 at line 5
# Function level1 at line 2
# Function <module> at line 11
This traceback is literally the linked list of frames that were active when the exception occurred—your exact path through the function call maze.
The Debugging Superpower
Understanding frames enables advanced debugging techniques:
import inspect

def debug_context():
    """Print the calling function's local variables"""
    caller_frame = inspect.currentframe().f_back
    print("Caller's locals:", caller_frame.f_locals)

def problematic_function():
    user_id = 12345
    data = {"name": "Alice", "age": 30}
    debug_context()  # Will print: {'user_id': 12345, 'data': {...}}

problematic_function()
You can inspect not just your own frame, but walk up the stack to see what called you, what called that, and so on.
The Technical Architecture
This design addresses a fundamental problem: how do you provide low-level introspection capabilities in a high-level language?
The Implementation Solution
Python’s approach: simulate the low-level concepts in a high-level way.
- Instead of exposing raw memory addresses, give you frame objects
- Instead of assembly instructions, give you bytecode operations
- Instead of CPU registers, give you a virtual value stack
- Instead of pointer arithmetic, give you safe attribute access
This design means inspect.currentframe() is:
- Fast: Direct access to an existing object
- Safe: No memory corruption possible
- Portable: Works identically on any platform
- Powerful: Full introspection without the danger
Why This Matters
Understanding this architecture helps you:
- Debug more effectively: You know what tools like
pdbare actually doing under the hood - Write better error handling: You understand how exceptions propagate through frames
- Optimize performance: You can reason about function call overhead
- Build meta-programming tools: You can safely introspect and modify runtime behavior
The Recursive Revelation
Want to see something that will make your systems programming professor proud? Let’s watch frames in action during recursion:
import inspect

def factorial(n, depth=0):
    indent = "  " * depth
    frame = inspect.currentframe()
    print(f"{indent}factorial({n}) - Frame locals: {frame.f_locals}")

    if n <= 1:
        return 1
    return n * factorial(n - 1, depth + 1)

factorial(3)
This produces:
factorial(3) - Frame locals: {'n': 3, 'depth': 0}
  factorial(2) - Frame locals: {'n': 2, 'depth': 1}
    factorial(1) - Frame locals: {'n': 1, 'depth': 2}
Each recursive call creates a new frame with its own copy of local variables. The stack grows downward, and as each call returns, frames are cleaned up in reverse order. This follows the same pattern described in systems programming textbooks.
From “Useless” Knowledge to Practical Power
This connection between low-level systems concepts and high-level Python features illustrates something profound about learning: seemingly abstract knowledge often becomes practical in unexpected ways.
The Skills Transfer
Those “boring” concepts from systems programming—stack frames, instruction pointers, call conventions—they’re not museum pieces. They’re the foundation that helps you understand:
- Why recursive functions can cause stack overflow errors
- How Python’s
inspectmodule works its magic - What’s happening when you see “maximum recursion depth exceeded”
- How debugging tools like
pdbstep through your code - Why certain optimizations (like tail call optimization) matter
The Compound Effect
Every time you use Python’s introspection capabilities—whether it’s debugging with pdb, building testing frameworks, or creating decorators that preserve function metadata—you’re benefiting from this deep architectural understanding.
That “expensive, useless” systems course? It just made you a more powerful Python programmer.
The Takeaway
Python’s frames aren’t magic—they’re a direct implementation of the same stack frame concepts you learned in systems programming. Understanding this connection transforms inspect.currentframe() from mysterious behavior into a predictable tool.
The next time you see a stack trace, remember: you’re looking at a linked list of PyFrameObjects, each one a snapshot of a function’s state at a specific moment in time. The next time you use a debugger, you’ll understand that it’s walking this same frame chain, providing access to Python’s virtual machine state.
And the next time someone tells you that low-level programming knowledge isn’t relevant in the age of high-level languages, you’ll have a concrete example of how those concepts apply directly to everyday programming tasks.
Because sometimes, spending time on “abstract” systems programming turns out to be exactly what you need to understand the machinery running beneath your Python code.